
15 June 2026
How the odds of winning Lotto are actually calculated
LottoBase Team · 4 min read
The odds of winning the Lotto jackpot are usually quoted as 1 in 45,057,474. It is a precise, slightly awkward figure, and it is easy to read straight past it without asking where it comes from. This post works through the calculation in plain English: why that number is what it is, and why it is fixed.
What we are actually counting
Lotto asks you to choose six numbers from 1 to 59, and winning the jackpot means matching all six that are drawn. So the odds come down to a single question: how many different six-number lines are possible? Every one of those lines is equally likely, so if there are N of them, your single line has a 1 in N chance of being the one drawn.
Picking six, if order mattered
Start by imagining the balls are drawn one at a time, and that the order matters. The first ball can be any of 59 numbers. Once it is out, 58 remain for the second, 57 for the third, and so on down to 54 for the sixth. Multiply those together:
59 × 58 × 57 × 56 × 55 × 54 = 32,441,381,280.
That is the number of ordered sequences — a little over 32 billion of them.
Order doesn’t matter, so we divide
But Lotto does not care about order. The line 4–8–15–16–23–42 is exactly the same ticket whether those numbers come out in that sequence or any other. So our 32 billion has counted every line many times over — once for each way its six numbers could have been arranged.
How many arrangements does a single set of six have? Six choices for which number comes first, five for the next, four for the one after, and so on: 6 × 5 × 4 × 3 × 2 × 1 = 720. (Mathematicians write this as 6! — “six factorial”.)
Each genuinely different line has therefore been counted 720 times inside that 32 billion. To get the number of distinct lines, we divide it out:
32,441,381,280 ÷ 720 = 45,057,474.
There it is. There are just over 45 million possible Lotto lines, each equally likely, so the chance that your one line is the drawn one is 1 in 45,057,474. This kind of count — selections where order is irrelevant — is what mathematicians call a combination, and it is the whole of the calculation.
Making 45 million tangible
A number that large is hard to feel, so it helps to put it somewhere you can picture. Wembley Stadium seats about 90,000 people. Imagine it sold out, every seat taken, and your task is to find one particular person — your closest friend — knowing only that they are somewhere in the ground. One seat in ninety thousand is already a long shot.
Now add the twist. It is not one stadium but five hundred: identical, full, and built side by side. Your friend is in a single seat in one of them, and you are told nothing about which. You get one guess — one stadium, one seat. Find them, first time, and you have the jackpot.
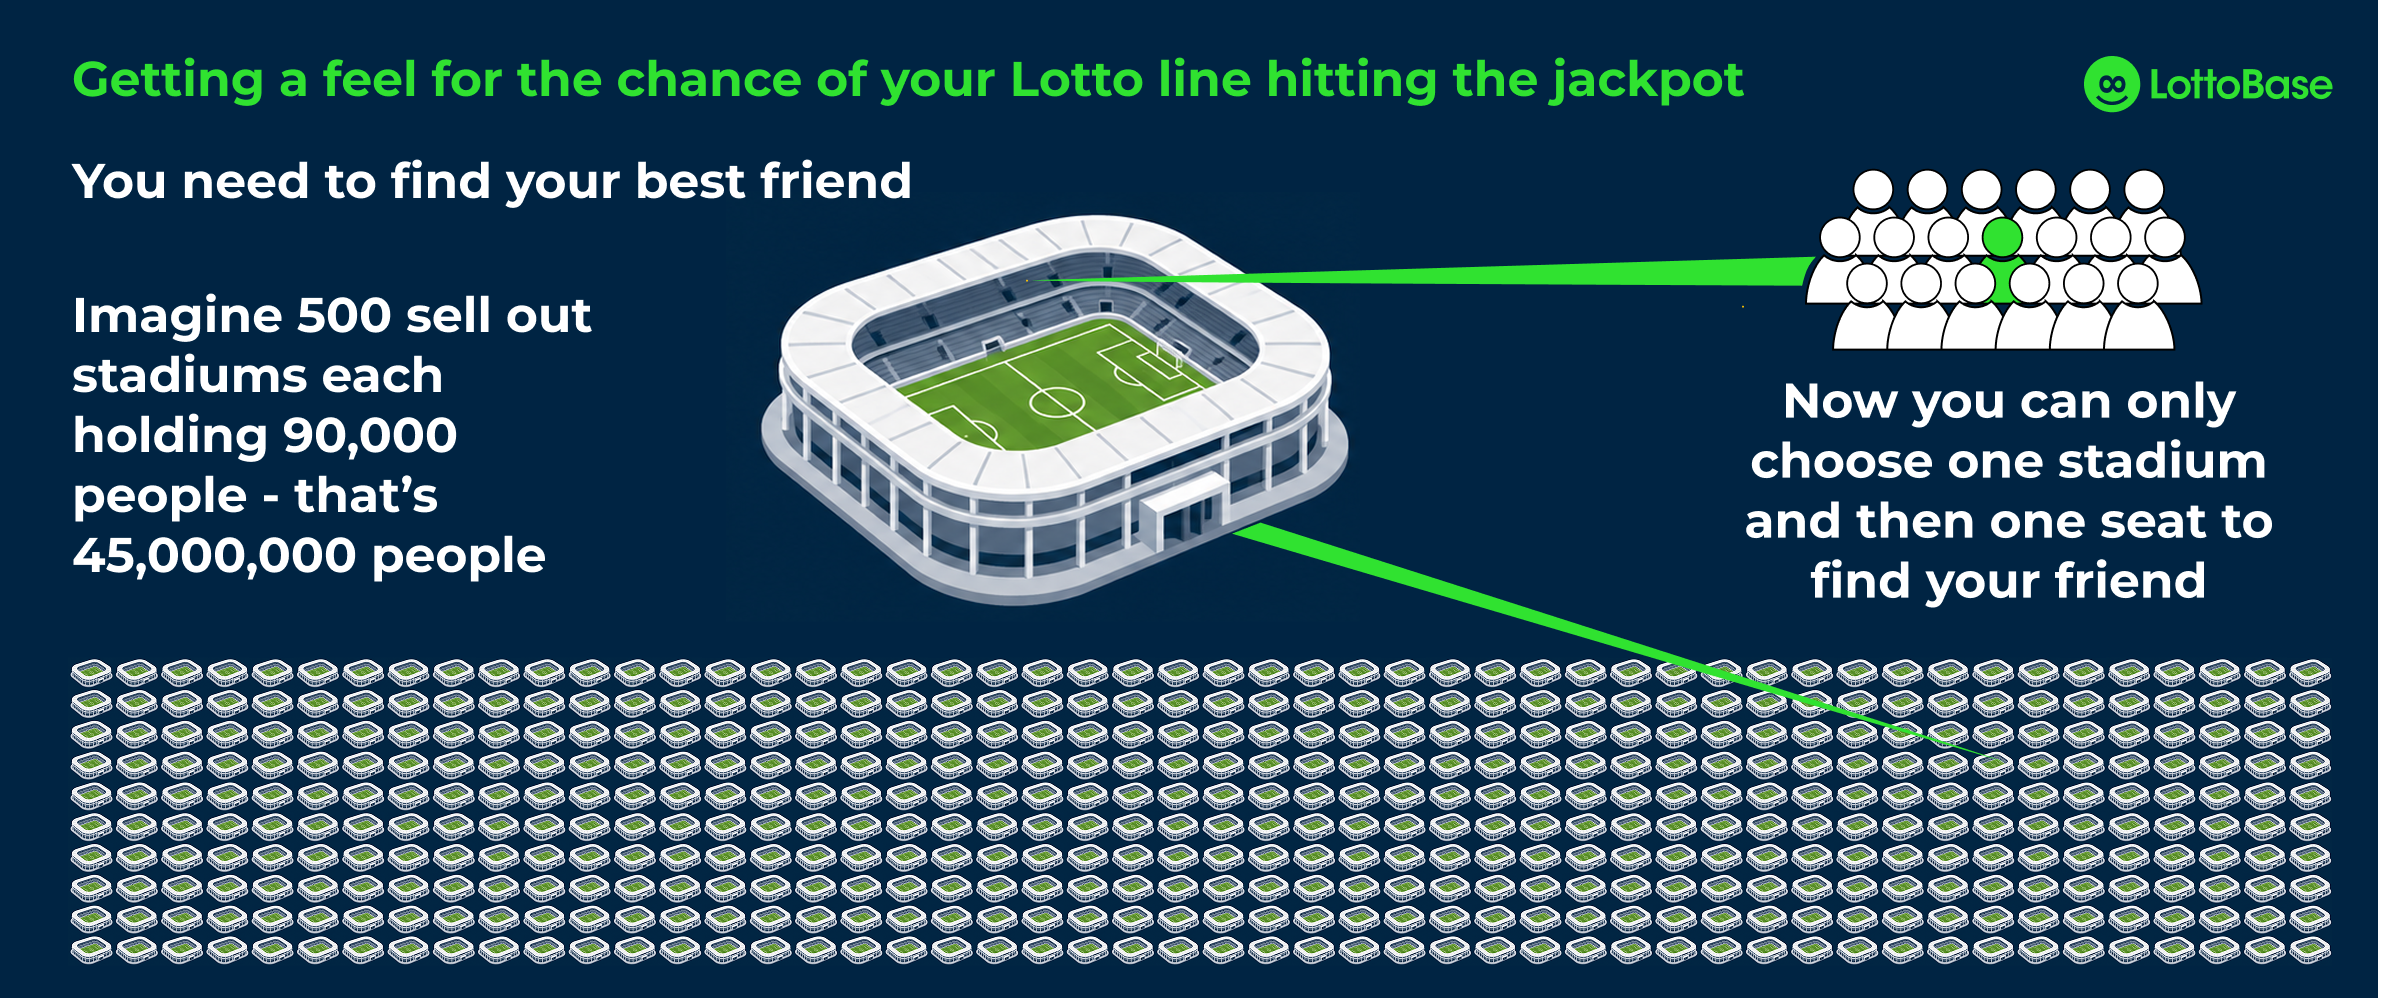
Five hundred sold-out Wembleys — about forty-five million seats — stand in for every possible Lotto line.
Five hundred sold-out Wembleys come to forty-five million seats, give or take, which is very nearly the field of lines you are choosing from. Picking the right seat in the right stadium, with a single attempt, is what 1 in 45,057,474 actually feels like. The only way to be certain of the jackpot would be to claim every seat in every stadium — to buy every possible line.
The lower tiers, briefly
The jackpot sits at the top of a table of prize tiers, and the smaller prizes have much shorter odds. The reason is the same counting in reverse: there are far more lines that match exactly three of the drawn numbers than there are lines that match all six, so matching three happens far more readily. Each tier’s odds come from the same combination arithmetic — only the question changes from “how many lines match all six” to “how many match exactly this many”. (The exact lower-tier prize amounts changed under the rules in force from 7 June 2026; LottoBase pulls the current figures into its Prize Breakdown, so there is no need to rely on a number copied from elsewhere.)
What this does and doesn’t tell you
The quiet but important point is that these odds are fixed and identical for every line. The sequence 1–2–3–4–5–6 has precisely the same 1 in 45,057,474 chance as any scattered-looking set, because each is just one line among the same 45 million. No method of choosing shortens those odds, and nothing about a number’s past can lengthen or shorten them either — each draw is an independent, random event.
That is also the honest way to read LottoBase’s Insights. They show what past draws have actually done — how often a line’s numbers have come up, when they last appeared, the shape of the gaps between appearances — as another way to choose your numbers with a sense of intention. None of it changes the odds above; it is simply a way of seeing the history rather than guessing at the future. Which line you would rather play is then a question only you can answer.
The lottery is, and remains, a game of chance, so play only what you can comfortably afford. Knowing exactly where 1 in 45,057,474 comes from will not improve those odds — but it does make the game a little less of a mystery.